BLOG
GOLD ALERT – A CRITICAL LOOK!
- By Terry J. Atzen
- •
- 27 May, 2016
Update on Gold
Gold has been a “hot” topic in the media so I decided to check-in on the subject – showing you what is really happening.
First of all, the Gold Index: (If you click on each chart it will make them larger)
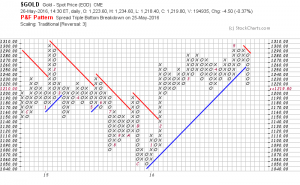
As you can see, Spot Gold (the real price of Gold) is currently in a column of Os as sellers have been controlling the market for most of the month of May.
What I want everyone to see are the number of times the price has gotten down to this low-1200 level – specifically between 1230 and 1200 – since February of this year.
This is an important level to watch.
If sellers take the price below 1200 it would indicate that the uptrend since the beginning of this year has, for the time being, run its course.
On the other hand, if buyers take the price over 1300, the uptrend will likely resume and would be a significant event for Gold as can be seen in the long-term weekly chart below.
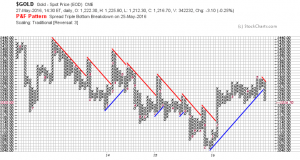
I know the print is small (sorry!), however the next few resistance levels are at 1340, 1390, 1430, 1470, 1800 and the old high which is just under 2000. The last two levels are not on this chart. The point is that there is lots of room for Gold to go higher.
Now, a look at GLD, the ETF I use to invest in Gold going up:
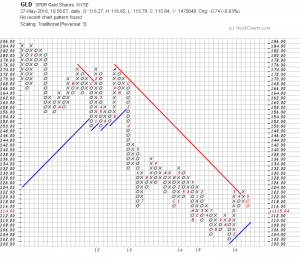
GLD is through the red resistance line however sellers remain persistent.
What is important here is the first support at 116. If sellers take the price below that, the next support is at the blue line – around the 110 level.
The final component of my analysis is the Inverse ETF of Gold – GLL.
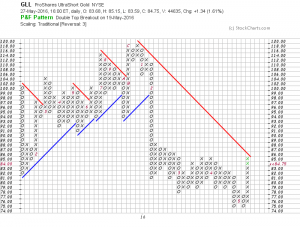
Here we can see that buyers have taken the price up to resistance level which helps verify my comments with GLD. And, that is that GLL is at resistance and needs to be watch in concert with GLD to aid us exactly what is happening with Gold in general.
If GLL goes over the red resistance line, there is pretty solid resistance just above that at 88.
If you have any questions or comments, please drop me a line at: terry@theinvestmentcompass.com
Weighing-In on Gold and Silver……..What’s the Real Truth
In the past few weeks, I have been amazed by the extreme range of predictions on the price of Gold and Silver (Harry Dent [ www.economyandmarkets.com ] says $750 and Jim Rickards [ www.silverdoctors.com/Jim-Rickards ] says $10,000), so I decided to weigh-in on the subject (without the predictions!).
Let me say first, that this is a great example of why I wrote my book and why I do the work that I do.
Pundits can, and do oftentimes confuse investors. This creates doubt and causes investors to ask, “Who do I believe? Who is correct? “What is the Truth?”, and as the result, end up doing nothing when their personal instincts say otherwise.
My work is about “What Is” – logical, simple and easy to understand.
As usual, my analysis begins with an index, in this case, the Index for each of the metals, then the respective ETFs as well as the Inverse ETFs for verification.
And, at the end of this blog, I will take a look at the Gold/Silver ratio that many folks like to monitor.
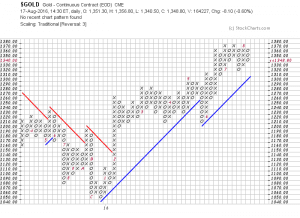
First, the Gold Index:
Once again, stocks are at a critical level and investors need to be aware of where the stock market is and pay attention to their stock portfolios.
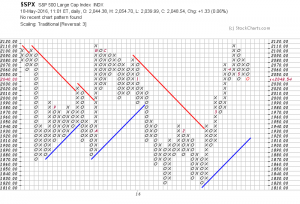
As you can see from the chart below of the S&P 500 Index, stocks made an amazing recovery from the 1820 level (twice this year) and ultimately reached the previous high made last year (at 2110).
Currently, the chart below of shows that prices are once again at a critical level as buyers and sellers continue their daily trading.

