
BLOG
KEEPING IT SIMPLE IS NOT STUPID
- By Terry J. Atzen
- •
- 13 Nov, 2014
If I have learned one thing in my 50 years of investing, it is that “Keeping it simple is not stupid”. As a matter of fact, “keeping it simple”, is the foundation of the work at The Investment Compass.
To begin with, most will agree that there is a lot of financial news thrown at us each day from the media (much of which is negative these days). And it seemingly is being thrown at us at an ever-increasing pace from the news print, television and on the internet. There is so much, in fact, that it has become a daunting task for investors to sift through it all in order to make an informed decision in today’s markets. How, where and what to investigate amidst all the “noise” and “chaos” is an important key.
At The Investment Compass we advocate keeping investigation simple and cutting to the chase. If this describes where you are in your thoughts, this article is meant as a reminder that a clear answer is available each moment of each day by simply looking at the point-and-figure (PNF) chart of whatever investment vehicle you are looking at – stocks, ETFs, mutual funds or commodities. A PNF is a pictorial representation of that minute-by-minute decision of the buyers and the sellers. After all is said and done, the price of any one of the above mentioned investments is resolved on the exchanges as the session for that investment proceeds. PNF charts illustrate the most basic of all economic laws: Supply and Demand – nothing more, nothing less.
One of the first questions investors often ask: Is what I am looking at in an uptrend, or a down trend? Are buyers buying or are sellers selling? And, at what price do buyers buy and at what price do sellers sell? When investors know that, they will have a clear picture as to what price parameters have prevailed. So when one looks at a PNF they are able to see when buyers are in control – columns of Xs on the PNF charts and when sellers prevail one sees columns of Os.
While looking at these columns over a period of time it is a simple matter to see resistance and support levels – in other words, when do sellers begin to, decide to, or decide to continue to sell and when do buyers begin to, decide to, or decide to continue to buy? The question on everyone’s mind is: Will newer highs be made this year? Are stocks going higher? Or, will the market reverse and go down from here? Predictions are being made nearly each day in an effort to answer these questions. However, the answer to those questions will ultimately be answered by the buyers and the sellers – no one else.
What is also important to remember is yet another Law. A basic Law of Physic: A body in motion will stay in motion until a greater or equal opposing force is applied. This Law, translated for investments is: An uptrend, created by buyers, will remain an uptrend until sellers (an opposing force) prevail, creating a flat or downtrend. OK. So, with that said, what is the bottom line? The market, as measured by the S&P 500, is currently at an all-time high. Support is around 1900 or roughly 100 points below current levels. Today’s conundrum is that the market is poised to go 100 points in either direction.
There are several strategies, depending on risk tolerance and opinion that investors might consider if they are long at this point: 1. If one is long and convinced the market will go higher, stay with your plan. 2. If one is sitting on profits, this not a bad time to take them – then wait for the PNF to indicate the next direction of the market. 3. If one is sitting on profits and not sure about staying with long positions or not confident the market will correct, one might consider selling calls, buying puts, buying an “inverse ETF” such as SH (an ETF) or employing any other favorite “hedge” strategy. 4. If one is happy taking profits, coming to the conclusion that the market is going to sell off, then buying puts or buying an “inverse ETF” is indicated.
Now, if an investor is not in the market and looking for an entry point, remember that the market is in an uptrend and will remain an uptrend until sellers (an opposing force) prevails (creating a down trend). So, after Rule #1: Keeping it Simple, remember Rule # 2: Pay attention and be guided by PNF charts. Terry J. Atzen The Investment Compass
Terry J Atzen at The Investment Compass™ (www.theinvestmentcompass.com)
Weighing-In on Gold and Silver……..What’s the Real Truth
In the past few weeks, I have been amazed by the extreme range of predictions on the price of Gold and Silver (Harry Dent [ www.economyandmarkets.com ] says $750 and Jim Rickards [ www.silverdoctors.com/Jim-Rickards ] says $10,000), so I decided to weigh-in on the subject (without the predictions!).
Let me say first, that this is a great example of why I wrote my book and why I do the work that I do.
Pundits can, and do oftentimes confuse investors. This creates doubt and causes investors to ask, “Who do I believe? Who is correct? “What is the Truth?”, and as the result, end up doing nothing when their personal instincts say otherwise.
My work is about “What Is” – logical, simple and easy to understand.
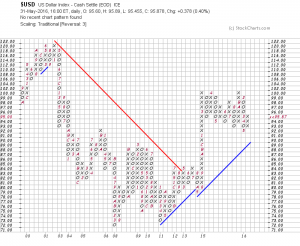
As usual, my analysis begins with an index, in this case, the Index for each of the metals, then the respective ETFs as well as the Inverse ETFs for verification.
And, at the end of this blog, I will take a look at the Gold/Silver ratio that many folks like to monitor.
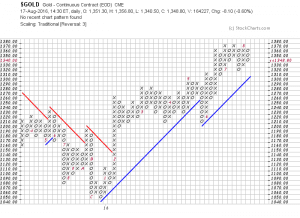
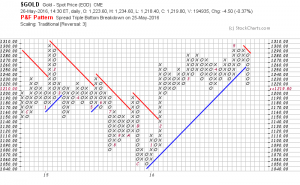
First, the Gold Index:
Update on Gold
Gold has been a “hot” topic in the media so I decided to check-in on the subject – showing you what is really happening.
First of all, the Gold Index: (If you click on each chart it will make them larger)